Moove Over guesswork.
Analytics & ReportingStop Guessing.
Start Knowing.
Every platform. Every post. Every campaign. MOOHOO™ brings your performance data into one clear, actionable dashboard — so you can see what's working and do more of it.
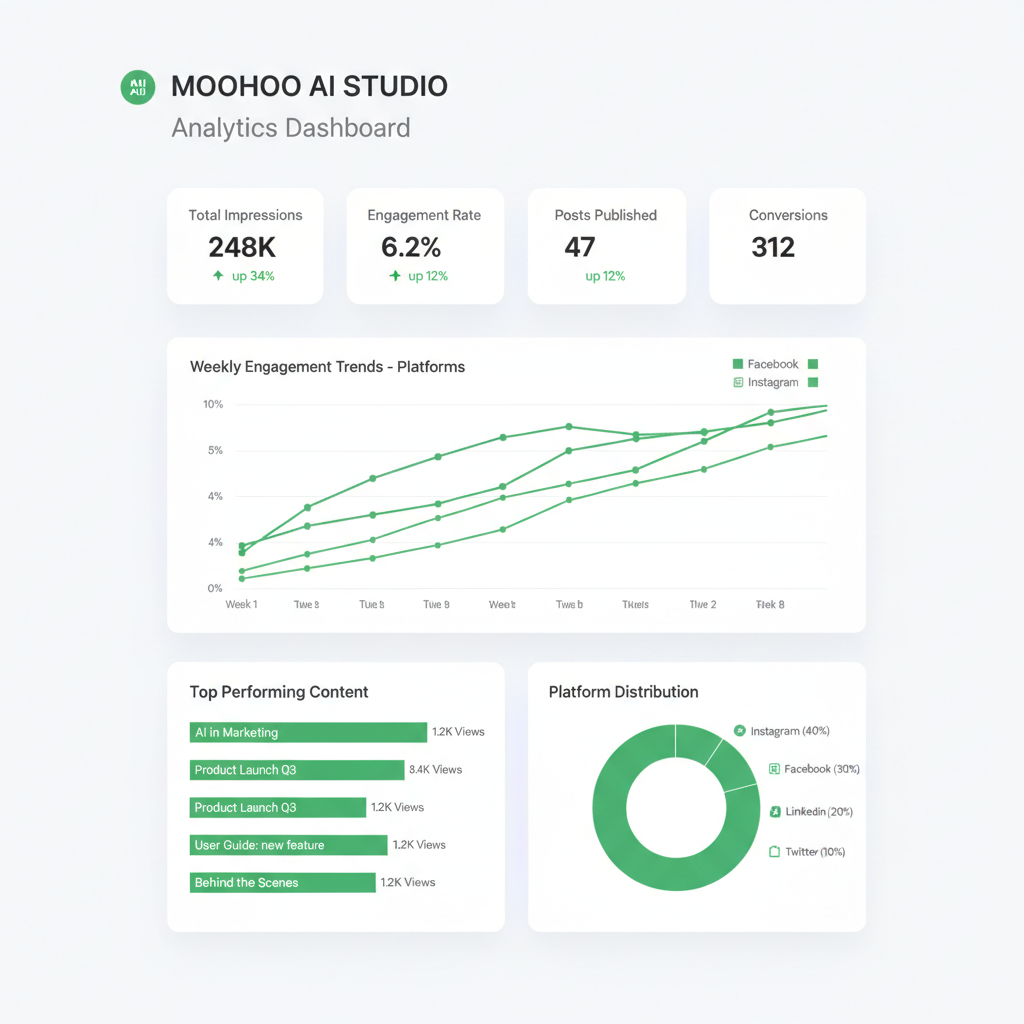
Your Analytics Dashboard
A live preview of what you'll see inside MOOHOO™.
Total Reach
24,831
Engagement Rate
8.4%
Content Published
47
Hours Saved
38hrs
Weekly Performance
🏆 Top Performing Posts
Per-Platform Breakdown
See exactly how each platform is performing — side by side.
Total Reach
9,400
Eng. Rate
9.2%
Posts
18
Total Reach
7,200
Eng. Rate
6.8%
Posts
14
Total Reach
5,100
Eng. Rate
11.4%
Posts
8
Twitter/X
Total Reach
3,131
Eng. Rate
4.2%
Posts
7
Everything You Need to Understand Your Data
Unified Dashboard
Every metric from every platform in one clear view. No switching between apps to understand your performance.
Date Range Comparisons
Compare this week to last week, this month to last month. See trends at a glance and spot what's working.
Top Performing Content
Instantly identify your best posts by reach, engagement, or clicks — and use that insight to create more of what works.
Automation Performance
Track open rates, click-throughs, and conversion rates for every workflow automation you've set up.
Growth Tracking
Monitor follower growth, audience trends, and engagement over time across all connected platforms.
Exportable Reports
Generate clean, client-ready reports in one click. Share with your team or send directly to clients.
Common Questions
See Your Business Clearly.
All your data. One dashboard. Zero confusion.